Showing posts with label endurance exercise. Show all posts

January 6, 2011

Does strength exercise increase nitrogen balance?

This previous post looks at the amounts of protein needed to maintain a nitrogen balance of zero. It builds on data about individuals doing endurance exercise, which increases the estimates a bit. The post also examines the issue of what happens when more protein than is needed in consumed; including by people doing strength exercise.

What that post does not look into is whether strength exercise, performed at the anaerobic range, increases nitrogen balance. If it did, it may lead to a counterintuitive effect: strength exercise, when practiced at a certain level of intensity, might enable individuals in calorie deficit to retain their muscle, and lose primarily body fat. That is, strength exercise might push the body into burning more body fat and less muscle than it would normally do under calorie deficit conditions.


(Strength exercise combined with a small calorie deficit may be one of the best approaches for body fat loss in women. Photo source: complete-strength-training.com)

Under calorie deficit people normally lose both body fat and muscle to meet caloric needs. About 25 percent of lean body mass is lost in sedentary individuals, and 33 percent or more in individuals performing endurance exercise. I suspect that strength exercise has the potential to either bring this percentage down to zero, or to even lead to muscle gain if the calorie deficit is very small. One of the reasons is the data summarized on this post.

Two other reasons are related to what happens with children, and the variation in spontaneous hunger up-regulation in response to various types of exercise. The first reason can be summarized as this: it is very rare for children to be in negative nitrogen balance (Brooks et al., 2005); even when they are under some, not extreme, calorie deficit. It is rare for children to be in negative nitrogen balance even when their daily consumption of protein is below 0.5 g per kg of body weight.

This suggests that, when children are in calorie deficit, they tend to hold on to protein stores (which are critical for growth), and shift their energy consumption to fat more easily than adults. The reason is that developmental growth powerfully stimulates protein synthesis. This leads to a hormonal mix that causes the body to be in anabolic state, even when other forces (e.g., calorie deficit, low protein intake) are pushing it into a catabolic state. In a sense, the tissues of children are always hungry for their building blocks, and they do not let go of them very easily.

The second reason is an interesting variation in the patterns of spontaneous hunger up-regulation in various athletes. The increase in hunger is generally lower for strength than endurance activities. The spontaneous increase for bodybuilders is among the lowest. Since being in a catabolic state tends to have a strong effect on hunger, increasing it significantly, these patterns suggest that strength exercise may actually contribute to placing one in an anabolic state. The duration of this effect is approximately 48 h. Some increase in hunger is expected, because of the increased calorie expenditure during and after strength exercise, but that is counterbalanced somewhat by the start of an anabolic state.

What is going on, and what does this mean for you?

One way to understand what is happening here is to think in terms of compensatory adaptation. Strength exercise, if done properly, tells the body that it needs more muscle protein. Calorie deficit, as long as it is short-term, tells the body that food supply is limited. The body’s short-term response is to keep muscle as much as possible, and use body fat to the largest extent possible to supply the body’s energy needs.

If the right stimuli are supplied in a cyclical manner, no long-term adaptations (e.g., lowered metabolism) will be “perceived” as necessary by the body. Let us consider a 2-day cycle where one does strength exercise on the first day, and rests on the second. A surplus of protein and calories on the first day would lead to both muscle and body fat gain. A deficit on the second day would lead to body fat loss, but not to muscle loss, as long as the deficit is not too extreme. Since only body fat is being lost, more is lost on the second day than on the first.

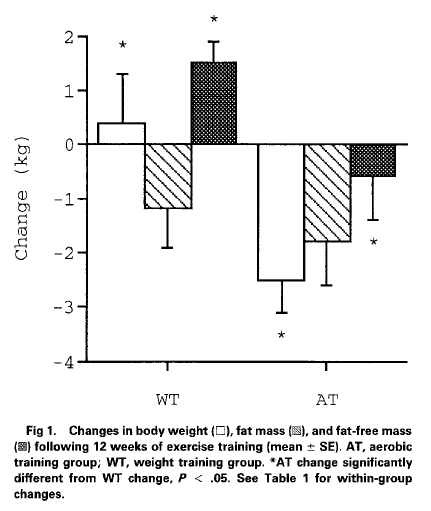
In this way, one can gain muscle and lose body fat at the same time, which is what seems to have happened with the participants of the Ballor et al. (1996) study. Or, one can keep muscle (not gaining any) and lose more body fat, with a slightly higher calorie deficit. If the calorie deficit is too high, one will enter negative nitrogen balance and lose both muscle and body fat, as often happens with natural bodybuilders in the pre-tournament “cutting” phase.

In a sense, the increase in protein synthesis stimulated by strength exercise is analogous to, although much less strong than, the increase in protein synthesis stimulated by the growth process in children.

References

Ballor, D.L., Harvey-Berino, J.R., Ades, P.A., Cryan, J., & Calles-Escandon, J. (1996). Contrasting effects of resistance and aerobic training on body composition and metabolism after diet-induced weight loss. Metabolism, 45(2), 179-183.

Brooks, G.A., Fahey, T.D., & Baldwin, K.M. (2005). Exercise physiology: Human bioenergetics and its applications. Boston, MA: McGraw-Hill.

December 30, 2010

How much protein does one need to be in nitrogen balance?

The figure below, from Brooks et al. (2005), shows a graph relating nitrogen balance and protein intake. A nitrogen balance of zero is a state in which body protein mass is stable; that is, it is neither increasing nor decreasing. The graph was taken from this classic study by Meredith et al. The participants in the study were endurance exercisers. As you can see, age is not much of a factor for nitrogen balance in this group.


Nitrogen balance is greater than zero (i.e., an anabolic state) for the vast majority of the participants at 1.2 g of protein per kg of body weight per day. To convert lbs to kg, divide by 2.2. A person weighing 100 lbs (45 kg) would need 55 g/d of protein; a person weighing 155 lbs (70 kg) would need 84 g/d; someone weighing 200 lbs (91 kg) would need 109 g/d.

The above numbers are overestimations of the amounts needed by people not doing endurance exercise, because endurance exercise tends to lead to muscle loss more than rest or moderate strength training. One way to understand this is compensatory adaptation; the body adapts to endurance exercise by shedding off muscle, as muscle is more of a hindrance than an asset for this type of exercise.

Total calorie intake has a dramatic effect on protein requirements. The above numbers assume that a person is getting just enough calories from other sources to meet daily caloric needs. If a person is in caloric deficit, protein requirements go up. If in caloric surplus, protein requirements go down. Other factors that increase protein requirements are stress and wasting diseases (e.g., cancer).

But what if you want to gain muscle?

Wilson & Wilson (2006) conducted an extensive review of the literature on protein intake and nitrogen balance. That review suggests that a protein intake beyond 25 percent of what is necessary to achieve a nitrogen balance of zero would have no effect on muscle gain. That would be 69 g/d for a person weighing 100 lbs (45 kg); 105 g/d for a person weighing 155 lbs (70 kg); and 136 g/d for someone weighing 200 lbs (91 kg). For the reasons explained above, these are also overestimations.

What if you go well beyond these numbers?

The excess protein will be used primarily as fuel; that is, it will be oxidized. In fact, a large proportion of all the protein consumed on a daily basis is used as fuel, and does not become muscle. This happens even if you are a gifted bodybuilder that can add 1 lb of protein to muscle tissue per month. So excess protein can make you gain body fat, but not by protein becoming body fat.

Dietary protein does not normally become body fat, but will typically be used in place of dietary fat as fuel. This will allow dietary fat to be stored. Dietary protein also leads to an insulin response, which causes less body fat to be released. In this sense, protein has a fat-sparing effect, preventing it from being used to supply the energy needs of the body. As long as it is available, dietary protein will be favored over dietary or body fat as a fuel source.

Having said that, if you were to overeat anything, the best choice would be protein, in the absence of any disease that would be aggravated by this. Why? Protein contributes fewer calories per gram than carbohydrates; many fewer when compared with dietary fat. Unlike carbohydrates or fat, protein almost never becomes body fat under normal circumstances. Dietary fat is very easily converted to body fat; and carbohydrates become body fat when glycogen stores are full. Finally, protein seems to be the most satiating of all macronutrients, perhaps because natural protein-rich foods are also very nutrient-dense.

It is not very easy to eat a lot of protein without getting also a lot of fat if you get your protein from natural foods; as opposed to things like refined seed/grain products or protein supplements. Exceptions are organ meats and seafood, which generally tend to be quite lean and protein-rich.

References

Brooks, G.A., Fahey, T.D., & Baldwin, K.M. (2005). Exercise physiology: Human bioenergetics and its applications. Boston, MA: McGraw-Hill.

Wilson, J., & Wilson, G.J. (2006). Contemporary issues in protein requirements and consumption for resistance trained athletes. Journal of the International Society of Sports Nutrition, 3(1), 7-27.

September 2, 2010

How to lose fat and gain muscle at the same time? Strength training plus a mild caloric deficit

Ballor et al. (1996) conducted a classic and interesting study on body composition changes induced by aerobic and strength training. This study gets cited a lot, but apparently for the wrong reasons. One of these reasons can be gleaned from this sentence in the abstract:

    “During the exercise training period, the aerobic training group … had a significant … reduction in body weight … as compared with the [strength] training group ...

That is, one of the key conclusions of this study was that aerobic training was more effective than strength training as far as weight loss is concerned. (The authors refer to the strength training group as the “weight training group”.)

Prior to starting the exercise programs, the 18 participants had lost a significant amount of weight through dieting, for a period of 11 weeks. The authors do not provide details on the diet, other than that it was based on “healthy” food choices. What this means exactly I am not sure, but my guess is that it was probably not particularly high or low in carbs/fat, included a reasonable amount of protein, and led to a caloric deficit.

The participants were older adults (mean age of 61; range, 56 to 70), who were also obese (mean body fat of 45 percent), but otherwise healthy. They managed to lose an average of 9 kg (about 20 lbs) during that 11-week period.

Following the weight loss period, the participants were randomly assigned to either a 12-week aerobic training (four men, five women) or weight training (four men, five women) exercise program. They exercised 3 days per week. These were whole-body workouts, with emphasis on compound (i.e., multiple-muscle) exercises. The figure below shows what actually happened with the participants.


As you can see, the strength training group (WT) gained about 1.5 kg of lean mass, lost 1.2 kg of fat, and thus gained some weight. The aerobic training group (AT) lost about 0.6 kg of lean mass and 1.8 kg of fat, and thus lost some weight.

Which group fared better? In terms of body composition changes, clearly the strength training group fared better. But my guess is that the participants in the strength training group did not like seeing their weight going up after losing a significant amount of weight through dieting. (An analysis of the possible psychological effects of this would be interesting; a discussion for another blog post.)

The changes in the aerobic training group were predictable, and were the result of compensatory adaptation. Their bodies changed to become better adapted to aerobic exercise, for which a lot of lean mass is a burden, as is a lot of fat mass.

So, essentially the participants in the strength training group lost fat and gained muscle at the same time. The authors say that the participants generally stuck with their weight-loss diet during the 12-week exercise period, but not a very strict away. It is reasonable to conclude that this induced a mild caloric deficit in the participants.

Exercise probably induced hunger, and possibly a caloric surplus on exercise days. If that happened, the caloric deficit must have occurred on non-exercise days. Without some caloric deficit there would not have been fat loss, as extra calories are stored as fat.

There are many self-help books and programs online whose main claim is to have a “revolutionary” prescription for concurrent fat loss and muscle gain – the “holy grail” of body composition change.

Well, it may be as simple as combining strength training with a mild caloric deficit, in the context of a nutritious diet focused on unprocessed foods.

Reference:

Ballor, D.L., Harvey-Berino, J.R., Ades, P.A., Cryan, J., & Calles-Escandon, J. (1996). Contrasting effects of resistance and aerobic training on body composition and metabolism after diet-induced weight loss. Metabolism, 45(2), 179-183.

June 27, 2010

Exercise and blood glucose levels: Insulin and glucose responses to exercise

The notion that exercise reduces blood glucose levels is widespread. That notion is largely incorrect. Exercise appears to have a positive effect on insulin sensitivity in the long term, but also increases blood glucose levels in the short term. That is, exercise, while it is happening, leads to an increase in circulating blood glucose. In normoglycemic individuals, that increase is fairly small compared to the increase caused by consumption of carbohydrate-rich foods, particularly foods rich in refined carbohydrates and sugars.

The figure below, from the excellent book by Wilmore and colleagues (2007), shows the variation of blood insulin and glucose in response to an endurance exercise session. The exercise session’s intensity was at 65 to 70 percent of the individuals’ maximal capacity (i.e., their VO2 max). The session lasted 180 minutes, or 3 hours. The full reference to the book by Wilmore and colleagues is at the end of this post.


As you can see, blood insulin levels decreased markedly in response to the exercise bout, in an exponential decay fashion. Blood glucose increased quickly, from about 5.1 mmol/l (91.8 mg/dl) to 5.4 mmol/l (97.2 mg/dl), before dropping again. Note that blood glucose levels remained somewhat elevated throughout the exercise session. But, still, the elevation was fairly small in the participants, which were all normoglycemic. A couple of bagels would easily induce a rise to 160 mg/dl in about 45 minutes in those individuals, and a much larger “area under the curve” glucose response than exercise.

So what is going on here? Shouldn’t glucose levels go down, since muscle is using glucose for energy?

No, because the human body is much more “concerned” with keeping blood glucose levels high enough to support those cells that absolutely need glucose, such as brain and red blood cells. During exercise, the brain will derive part of its energy from ketones, but will still need glucose to function properly. In fact, that need is critical for survival, and may be seen as a bit of an evolutionary flaw. Hypoglycemia, if maintained for too long, will lead to seizures, coma, and death.

Muscle tissue will increase its uptake of free fatty acids and ketones during exercise, to spare glucose for the brain. And muscle tissue will also consume glucose, in part for glycogenesis; that is, for making muscle glycogen, which is being depleted by exercise. In this sense, we can say that muscle tissue is becoming somewhat insulin resistant, because it is using more free fatty acids and ketones for energy, and thus less glucose. Another way of looking at this, however, which is favored by Wilmore and colleagues (2007), is that muscle tissue is becoming more insulin sensitive, because it is still taking up glucose, even though insulin levels are dropping.

Truth be told, the discussion in the paragraph above is mostly academic, because muscle tissue can take up glucose without insulin. Insulin is a hormone that allows the pancreas, its secreting organ, to communicate with two main organs – the liver and body fat. (Yes, body fat can be seen as an “organ”, since it has a number of endocrine functions.) Insulin signals to the liver that it is time to take up blood glucose and either make glycogen (to be stored in the liver) or fat with it (secreting that fat in VLDL particles). Insulin signals to body fat that it is time to take up blood glucose and fat (e.g., packaged in chylomicrons) and make more body fat with it. Low insulin levels, during exercise, will do the opposite, leading to low glucose uptake by the liver and an increase in body fat catabolism.

Resistance exercise (e.g., weight training) induces much higher glucose levels than endurance exercise; and this happens even when one has fasted for 20 hours before the exercise session. The reason is that resistance exercise leads to the conversion of muscle glycogen into energy, releasing lactate in the process. Lactate is in turn used by muscle tissues as a source of energy, helping spare glycogen. It is also used by the liver for production of glucose through gluconeogenesis, which significantly elevates blood glucose levels. That hepatic glucose is then used by muscle tissues to replenish their depleted glycogen stores. This is known as the Cori cycle.

Exercise seems to lead, in the long term, to insulin sensitivity; but through a fairly complex and longitudinal process that involves the interaction of many hormones. One of the mechanisms may be an overall reduction in insulin levels, leading to increased insulin sensitivity as a compensatory adaptation. In the short term, particularly while it is being conducted, exercise nearly always increases blood glucose levels. Even in the first few months after the beginning of an exercise program, blood glucose levels may increase. If a person who was on a low carbohydrate diet started a 3-month exercise program, it is quite possible that the person’s average blood glucose would go up a bit. If low carbohydrate dieting began together with the exercise program, then average blood glucose might drop significantly, because of the acute effect of this type of dieting on average blood glucose.

Still exercise is health-promoting. The combination of the long- and short-term effects of exercise appears to lead to an overall slowing down of the progression of insulin resistance with age. This is a good thing.

Reference:

Wilmore, J.H., Costill, D.L., & Kenney, W.L. (2007). Physiology of sport and exercise. Champaign, IL: Human Kinetics.

June 15, 2010

Soccer as play and exercise: Resistance and endurance training at the same time

Many sports combine three key elements that make them excellent fitness choices: play, resistance exercise, and endurance exercise; all at the same time. Soccer is one of those sports. Its popularity is growing, even in the US! The 2010 FIFA World Cup, currently under way in South Africa, is a testament to that. It helps that the US team qualified and did well in its first game against England.

Pelé is almost 70 years old in the photo below, from Wikipedia. He is widely regarded as the greatest soccer player of all time. But not by Argentineans, who will tell you that Pelé is probably the second greatest soccer player of all time, after Maradona.


Even though Brazil is not a monarchy, Pelé is known there as simply “The King”. How serious are Brazilians about this? Well, consider this. Fernando Henrique Cardoso was one of the most popular presidents of Brazil. He was very smart; he appointed Pelé to his cabinet. But when Cardoso had a disagreement with Pelé he was broadly chastised in Brazil for disrespecting “The King”, and was forced to publicly apologize or blow his political career!

Arguably soccer is a very good choice of play activity to be used in combination with resistance exercise. When used alone it is likely to lead to much more lower- than upper-body muscle development. Unlike before the 1970s, most soccer players today use whole body resistance exercise as part of their training. Still, you often see very developed leg muscles and relatively slim upper bodies.

What leads to leg muscle gain are the sprints. Interestingly, it is the eccentric part of the sprints that add the most muscle, by causing the most muscle damage. That is, it not the acceleration, but the deceleration phase that leads to the largest gains in leg muscle.

This eccentric phase effect is true for virtually all types of anaerobic exercise, and a well known fact among bodybuilders and exercise physiologists (see, e.g., Wilmore et al., 2007; full reference at the end of the post). For example, it is not the lifting, but the lowering of the bar in the chest press, which leads to the most muscle gain.

Like many sports practiced at high levels of competition, professional soccer can lead to serious injuries. So can non-professional, but highly competitive play. Common areas of injury are the ankles and the knees. See Mandelbaum & Putukian (1999) for a discussion of possible types of health problems associated with soccer; it focuses on females, but is broad enough to serve as a general reference. The full reference and link to the article are given below.

References:

Mandelbaum, B.R., & Putukian, M. (1999). Medical concerns and specificities in female soccer players. Science & Sports, 14(5), 254-260.

Wilmore, J.H., Costill, D.L., & Kenney, W.L. (2007). Physiology of sport and exercise. Champaign, IL: Human Kinetics.

June 4, 2010

Growth hormone secretion drops with age, but not exactly in the way you would expect

Many people assume that growth hormone secretion drops with age in a somewhat linear fashion, as implied by this diagram. This assumption probably stems from attempts to model growth hormone variations with linear regression algorithms. This assumption is wrong.

Actual plots of growth hormone secretion patterns, with age on the horizontal axes, tell a different story. See, for example, the graphs below, from professionalmuscle.com. They match the graphs one sees in empirical academic papers. The graphs below (click to enlarge) are particularly good at highlighting some interesting patterns of variation.


On the left side, bar charts show secretion patterns grouped by age ranges during a 24 h period (at the top), during wake time (at the middle), and during sleep (at the bottom). On the right side is the actual data used to build the bar charts. As you can see from the graphs on the right side, the drop in growth hormone secretion follows a pattern that looks a lot more like an exponential decay than a linear pattern.

The drop is very steep from 15 to 40 years of age, after which it shows some fluctuations, going up and down. Interestingly, people in their 50s and 60s, at least in this dataset, have on average higher growth hormone levels than people in their 40s. Of course this may be due to sample bias, but the graphs suggest that there is a major drop in growth hormone secretion, on average, around age 45.

As you can see, there is a lot of individual variation in growth hormone levels. If you look carefully at the graph on the top-right corner, you will see a 50 year old who has a higher 24 h growth hormone secretion than many folks in 15-30 age range. This pattern of individual variation is common for the vast majority of traits anyway, and often the distribution of traits follows a normal, or bell-shaped, distribution. The bell-shaped distribution becomes clear when the traits are plotted based on frequency.

Growth hormone is secreted in pulses. In case you are wondering, growth hormone secretion in young women is higher than in young men. See the graphs below (click to enlarge), from this excellent article on growth hormone by Cummings and Merrian.


Yet, women do not put on a lot of muscle mass in response to weight training, regardless of the age at which they do weight training. This means that growth hormone, by itself, does not lead to significant gains in muscle mass. Androgenic hormones, like testosterone, play a key moderator role here. Muscle mass gain is the result of a number of things, including the combined action of various hormones. To complicate things further, not only do these hormones act together in an additive fashion, but they also influence each other.

Another reasonable conclusion from the data above on growth hormone secretion in young women and men is that growth hormone must indeed have major health-promoting effects, as most of the empirical data suggests. The reason is that, from an evolutionary standpoint, young (or pre-menopausal) women have always been the evolutionary bottleneck of any population of ancestral hominids. High survival rates among young women were a lot more important than high survival rates among men in general, in terms of the chances of survival of any population of ancestral hominids.

Higher survival rates among young ancestral women may have been enabled by higher levels of growth hormone, among other things. The onset of the metabolic syndrome, which is frequently in modern humans around age 45, may also be strongly influenced by falling growth hormone levels.

How can growth hormone secretion be increased after age 45? One obvious option is vigorous exercise, particularly resistance exercise.

May 30, 2010

Growth hormone may rise 300 percent with exercise: Acute increases also occur in cortisol, adrenaline, and noradrenaline

The figure below (click to enlarge) is from the outstanding book Physiology of sport and exercise, by Jack H. Wilmore, David L. Costill, and W. Larry Kenney. If you are serious about endurance or resistance exercise, or want to have a deeper understanding of exercise physiology beyond what one can get in popular exercise books, this book should be in your personal and/or institutional library. It is one of the most comprehensive textbooks on exercise physiology around. The full reference to the book is at the end of this post.


The hormonal and free fatty acid responses shown on the two graphs are to relatively intense exercise combining aerobic and anaerobic components. Something like competitive cross-country running in an area with hills would lead to that type of response. As you can see, cortisol spikes at the beginning, combining forces with adrenaline and noradrenaline (a.k.a. epinephrine and norepinephrine) to quickly increase circulating free fatty acid levels. Then free fatty acid levels are maintained elevated by adrenaline, noradrenaline, and growth hormone. As you can see from the graphs, free fatty acid levels are initially pulled up by cortisol, and then are very strongly correlated with adrenaline and noradrenaline.  Those free fatty acids feed muscle, and also lead to the production of ketones, which provide extra fuel for muscle tissue.

Growth hormone stays flat for about 40 minutes, after which it goes up steeply. At around the 90-minute mark, it reaches a level that is quite high; 300 percent higher than it was prior to the exercise session. Natural elevation of circulating growth hormone through intense exercise, intermittent fasting, and restful sleep, leads to a number of health benefits. It helps burn abdominal fat, often hours after the exercise session, and helps builds muscle (in conjunction with other hormones, such as testosterone). It appears to increase insulin sensitivity in the long run. Maybe natural elevation of circulating growth hormone is one of the “secrets” of people like Bob Delmonteque, who is probably the fittest octogenarian in the world today.

Aerobic activities normally do not elevate growth hormone levels, even though they are healthy, unless they lead to a significant degree of glycogen depletion. Glycogen is stored in the liver and muscle, with muscle storing about 5 times more than the liver (about 500 g in adults). Once those reserves go down significantly during exercise, it seems that growth hormone is recruited to ramp up fat catabolism and facilitate other metabolic processes. Walking for an hour, even if briskly, is good for fat burning, but generates only a small growth hormone elevation. Including a few all-out sprints into that walk can help significantly increase growth hormone secretion.

Having said that, it is not really clear whether growth hormone elevation is a response to glycogen depletion, or whether both happen together in response to another stimulus or related metabolic process. There are other factors that come into play as well. For example, circulating growth hormone increase is moderated by sex hormone (e.g., testosterone, estrogen) secretion, thus larger growth hormone increases in response to exercise are observed in older men than in older women. (Testosterone declines more slowly with age in men than estrogen does in women.) Also, growth hormone increase seems to be correlated with an increase in circulating ketones.

Heavy resistance exercise seems to lead to a higher growth hormone elevation per unit of time than endurance exercise. That is, an intense resistance training session lasting only 30 minutes can lead to an acute circulating growth hormone response, similar to that shown on the figure. The key seems to be reaching the point during the exercise where muscle glycogen stores are significantly depleted. Many people who weight-train achieve this regularly by combining a reasonable number of sets (e.g., 6-12), with repetitions in the muscle hypertrophy range (again, 6-12); and progressive overload, whereby resistance is increased incrementally every session.

Progressive overload is needed because glycogen reserves are themselves increased in response to training, so one has to increase resistance every session to keep up with those increases. This goes on only up to a point, a point of saturation, usually reached by elite athletes. Glycogen is the primary fuel for anaerobic exercise; fat is used as fuel in the recovery period between sets, and after the exercise is over. Glycogen is expended proportionally to the number of calories used in the anaerobic effort. Calories are expended proportionally to the total amount of weight moved around, and are also a function of the movements performed (moving a certain weight 1 feet spends less energy than moving it 3 feet). By the way, not much glycogen is depleted in a 30-minute session. The total caloric expenditure will probably be around 250 calories above the basal metabolic rate, which will require about 63 g of glycogen.

Many sensations are associated with reaching the glycogen depletion level required for an acute growth hormone response during heavy anaerobic exercise. Often light to severe nausea is experienced. Many people report a “funny” feeling, which is unmistakable to them, but very difficult to describe. In some people the “funny” feeling is followed, after even more exertion, by a progressively strong sensation of “pins and needles”, which, unlike that associated with a heart attack, comes slowly and also goes away slowly with rest. Some people feel lightheaded as well.

It seems that the optimal point is reached immediately before the above sensations become bothersome; perhaps at the onset of the “funny” feeling. My personal impression is that the level at which one experiences the “pins and needles” sensation should be avoided, because that is a point where your body is about to “force” you to stop exercising. (Note: I am not a bodybuilder; see “Interesting links” for more extensive resources on the subject.) Besides, go to that point or beyond and significant muscle catabolism may occur, because the body prioritizes glycogen reserves over muscle protein. It will break that protein down to produce glucose via gluconeogenesis to feed muscle glycogenesis.

That the body prioritizes muscle glycogen reserves over muscle protein is surprising to many, but makes evolutionary sense. In our evolutionary past, there were no selection pressures on humans to win bodybuilding tournaments. For our hominid ancestors, it was more important to have the glycogen tank at least half-full than to have some extra muscle protein. Without glycogen, the violent muscle contractions needed for a “fight or flight” response to an animal attack simply cannot happen. And large predators (e.g., a bear) would not feel intimated by big human muscles alone; it would be the human’s response using those muscles that would result in survival or death.

Overall, selection pressures probably favored functional strength combined with endurance, leading to body types similar to those of the hunter-gatherers shown on this post.

Even though the growth hormone response to exercise can be steep, the highest natural growth hormone spike seems to be the one that occurs at night, during deep sleep.

Exercising hard pays off, but only if one sleeps well.

Reference:

Wilmore, J.H., Costill, D.L., & Kenney, W.L. (2007). Physiology of sport and exercise. Champaign, IL: Human Kinetics.

May 9, 2010

Long distance running causes heart disease, unless it doesn’t

Regardless of type of exercise, disease markers are generally associated with intensity of exertion over time. This association follows a J-curve pattern. Do too little of it, and you have more disease; do too much, and incidence of disease goes up. There is always an optimal point, for each type of exercise and marker. A J curve is actually a U curve, with a shortened left end. The reason for the shortened left end is that, when measurements are taken, usually more measures fall on the right side of the curve than on the left.

The figure below (click to enlarge) shows a schematic representation that illustrates this type of relationship. (I am not very good at drawing.) Different individuals have different curves. If the vertical axis was a measure of health, as opposed to disease, then the curve would have the shape of an inverted J.


The idea that long distance running causes heart disease has been around for a while. Is it correct?

If it is, then one would expect to see certain things. For example, let’s say you take a group of long distance runners who have been doing that for a while, ideally runners above age 50. That is when heart disease becomes more frequent. This would also capture more experienced runners, with enough running experience to cause some serious damage. Let us say you measured markers of heart disease before and after a grueling long distance race. What would you see?

If long distance running causes heart disease, you would see a significant proportion with elevated makers of heart disease among the runners at baseline (i.e., before the race). After all, running is causing a cumulative problem. The levels of those markers would be correlated with practice, or participation in previous races, since the races are causing the damage. Also, you would see a uniformly bad increase in the markers after the race, as the running is messing up everybody more or less equally.

Sahlén and colleagues (2009), a group of Swedish researchers, studied males and females aged 55 or older who participated in a 30-km (about 19-mile) cross-country race. The full reference to the article is at the end of this post. The researchers included only runners who had no diagnosed medical disorders in their study. They collected data on the patterns of exercise prior to the race, and participation in previous races. Blood was taken before and after the race, and several measurements were obtained, including measurements of two possible heart disease markers: N-terminal pro-brain natriuretic peptide (NT-proBNP), and troponin T (TnT). The table below (click to enlarge) shows several of those measurements before and after the race.


We can see that NT-proBNP and TnT increased significantly after the race. So did creatinine, a byproduct of breakdown in muscle tissue of creatine phosphate; something that you would expect after such a grueling race. Yep, long distance running increases NT-proBNP and TnT, so it leads to heart disease, right?

Wait, not so fast!

NT-proBNP and TnT levels usually increase after endurance exercise, something that is noted by the authors in their literature review. But those levels do not stay elevated for too long after the race. Being permanently elevated, that is a sign of a problem. Also, excessive elevation during the race is also a sign of a potential problem.

Now, here is something interesting. Look at the table below, showing the variations grouped by past participation in races.


The increases in NT-proBNP and TnT are generally lower in those individuals that participated in 3 to 13 races in the past. They are higher for the inexperienced runners, and, in the case of NT-proBNP, particularly for those with 14 or more races under their belt (the last group on the right). The baseline NT-proBNP is also significantly higher for that group. They were older too, but not by much.

Can you see a possible J-curve pattern?

Now look at this table below, which shows the results of a multiple regression analysis on its right side. Look at the last column on the right, the beta coefficients. They are all significant, but the first is .81, which is quite high for a standardized partial regression coefficient. It refers to an almost perfect relationship between the log of NT-proBNP increase and the log of baseline NT-proBNP. (The log transformations reflect the nonlinear relationships between NT-proBNP, a fairly sensitive health marker, and the other variables.)


In a multiple regression analysis, the effect of each independent variable (i.e., each predictor) on the dependent variable (the log of NT-proBNP increase) is calculated controlling for the effects of all the other independent variables on the dependent variable. Thus, what the table above is telling us is that baseline NT-proBNP predicts NT-proBNP increase almost perfectly, even when we control for age, creatinine increase, and race duration (i.e., amount of time a person takes to complete the race).

Again, even when we control for: AGE, creatinine increase, and RACE DURATION.

In order words, baseline NT-proBNP is what really matters; not even age makes that much of a difference. But baseline NT-proBNP is NEGATIVELY correlated with number of previous races. The only exception is the group that participated in 14 or more previous races. Maybe that was too much for them.

Okay, one more table. This one, included below, shows regression analyses between a few predictors and the main dependent variable, which in this case is TnT elevation. No surprises here based on the discussion so far. Look at the left part, the column labeled as “B”. Those are correlation coefficients, varying from -1 to 1. Which is the predictor with the highest absolute correlation with TnT elevation? It is number of previous races, but the correlation is, again, NEGATIVE.


In follow-up tests after the race, 9 out of the 185 participants (4.9 percent) showed more decisive evidence of heart disease. One of those died while training a few months after the race. An autopsy was conducted showing abnormal left ventricular hypertrophy with myocardial fibrosis, coronary artery narrowing, and an old myocardial scar.

Who were the 9 lucky ones? You guessed it. Those were the ones who had the largest increases in NT-proBNP during the race. And large increases in NT-proBNP were more common among the runners who were too inexperienced or too experienced. The ones at the extremes.

So, here is a summary of what this study is telling us:

- The 30-km cross-country race studied is no doubt a strenuous activity. So if you have not exercised in years, perhaps you should not start with this kind of race.

- By and large, individuals who had elevated markers of heart disease prior to the race also had the highest elevations of those markers after the race.

- Participation in past races was generally protective, likely due to compensatory body adaptations, with the exception of those who did too much of that.

- Prevalence of heart disease among the runners was measured at 4.9 percent. This does not beat even the mildly westernized Inuit, but certainly does not look so bad considering that the general prevalence of ischemic heart disease in the US and Sweden is about 6.8 percent.

It seems reasonable to conclude that long distance running may be healthy, unless one does too much of it. The ubiquitous J-curve pattern again.

How much is too much? It certainly depends on each person’s particular health condition, but the bar seems to be somewhat high on average: participation in 14 or more previous 30-km races.

As for the 4.9 percent prevalence of heart disease among runners, maybe it is caused by something else, and endurance running may actually be protective, as long as it is not taken to extremes. Maybe that something else is a diet rich in refined carbohydrates and sugars, or psychological stress caused by modern life, or a combination of both.

Just for the record, I don’t do endurance running. I like walking, sprinting, moderate resistance training, and also a variety of light aerobic activities that involve some play. This is just a personal choice; nothing against endurance running.

Mark Sisson was an accomplished endurance runner; now he does not like it very much. (Click here to check his excellent book The Primal Blueprint). Arthur De Vany is not a big fan of endurance running either.

Still, maybe the Tarahumara and hunter-gatherer groups who practice persistence hunting are not such huge exceptions among humans after all.

Reference:

Sahlén, A., Gustafsson, T.P., Svensson, J.E., Marklund, T., Winter, R., Linde, C., & Braunschweig, F. (2009). Predisposing Factors and Consequences of Elevated Biomarker Levels in Long-Distance Runners Aged >55 Years. The American Journal of Cardiology, 104(10), 1434–1440.